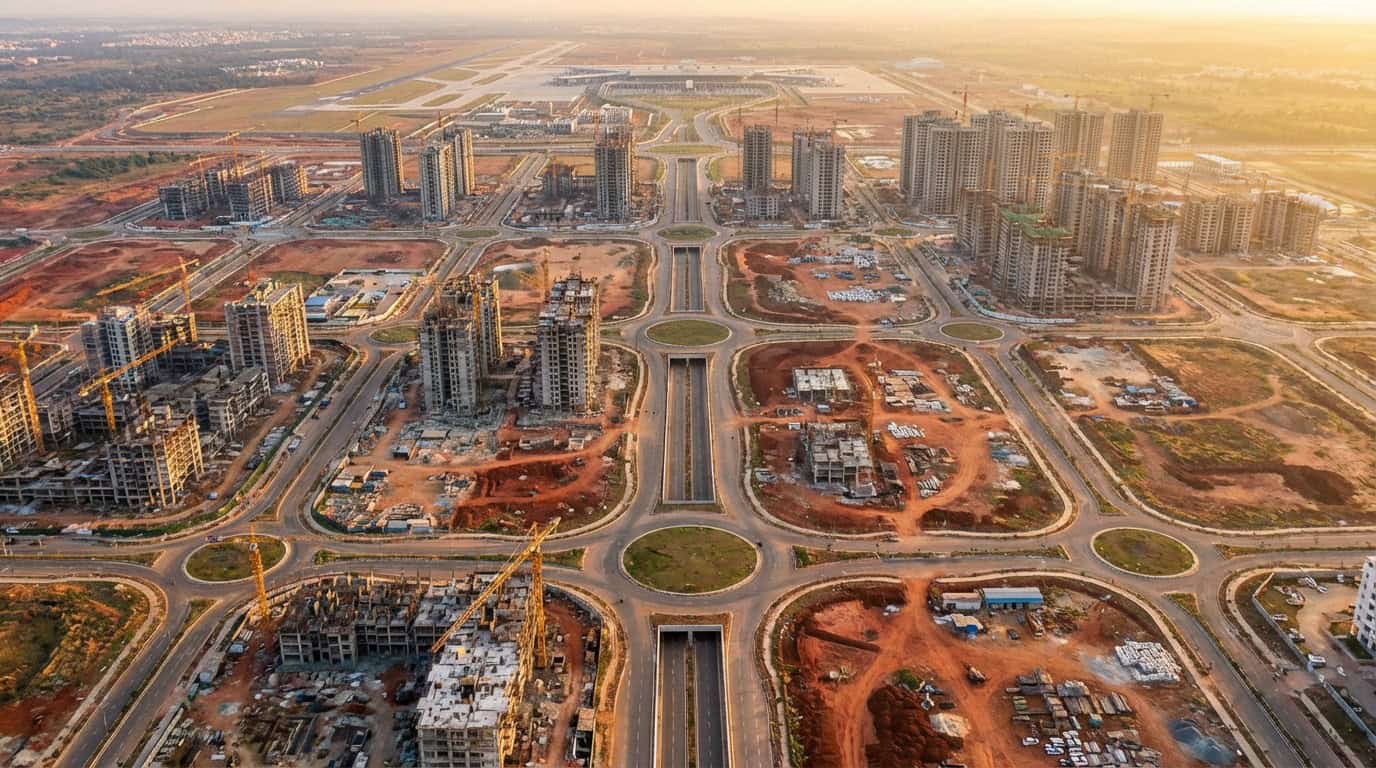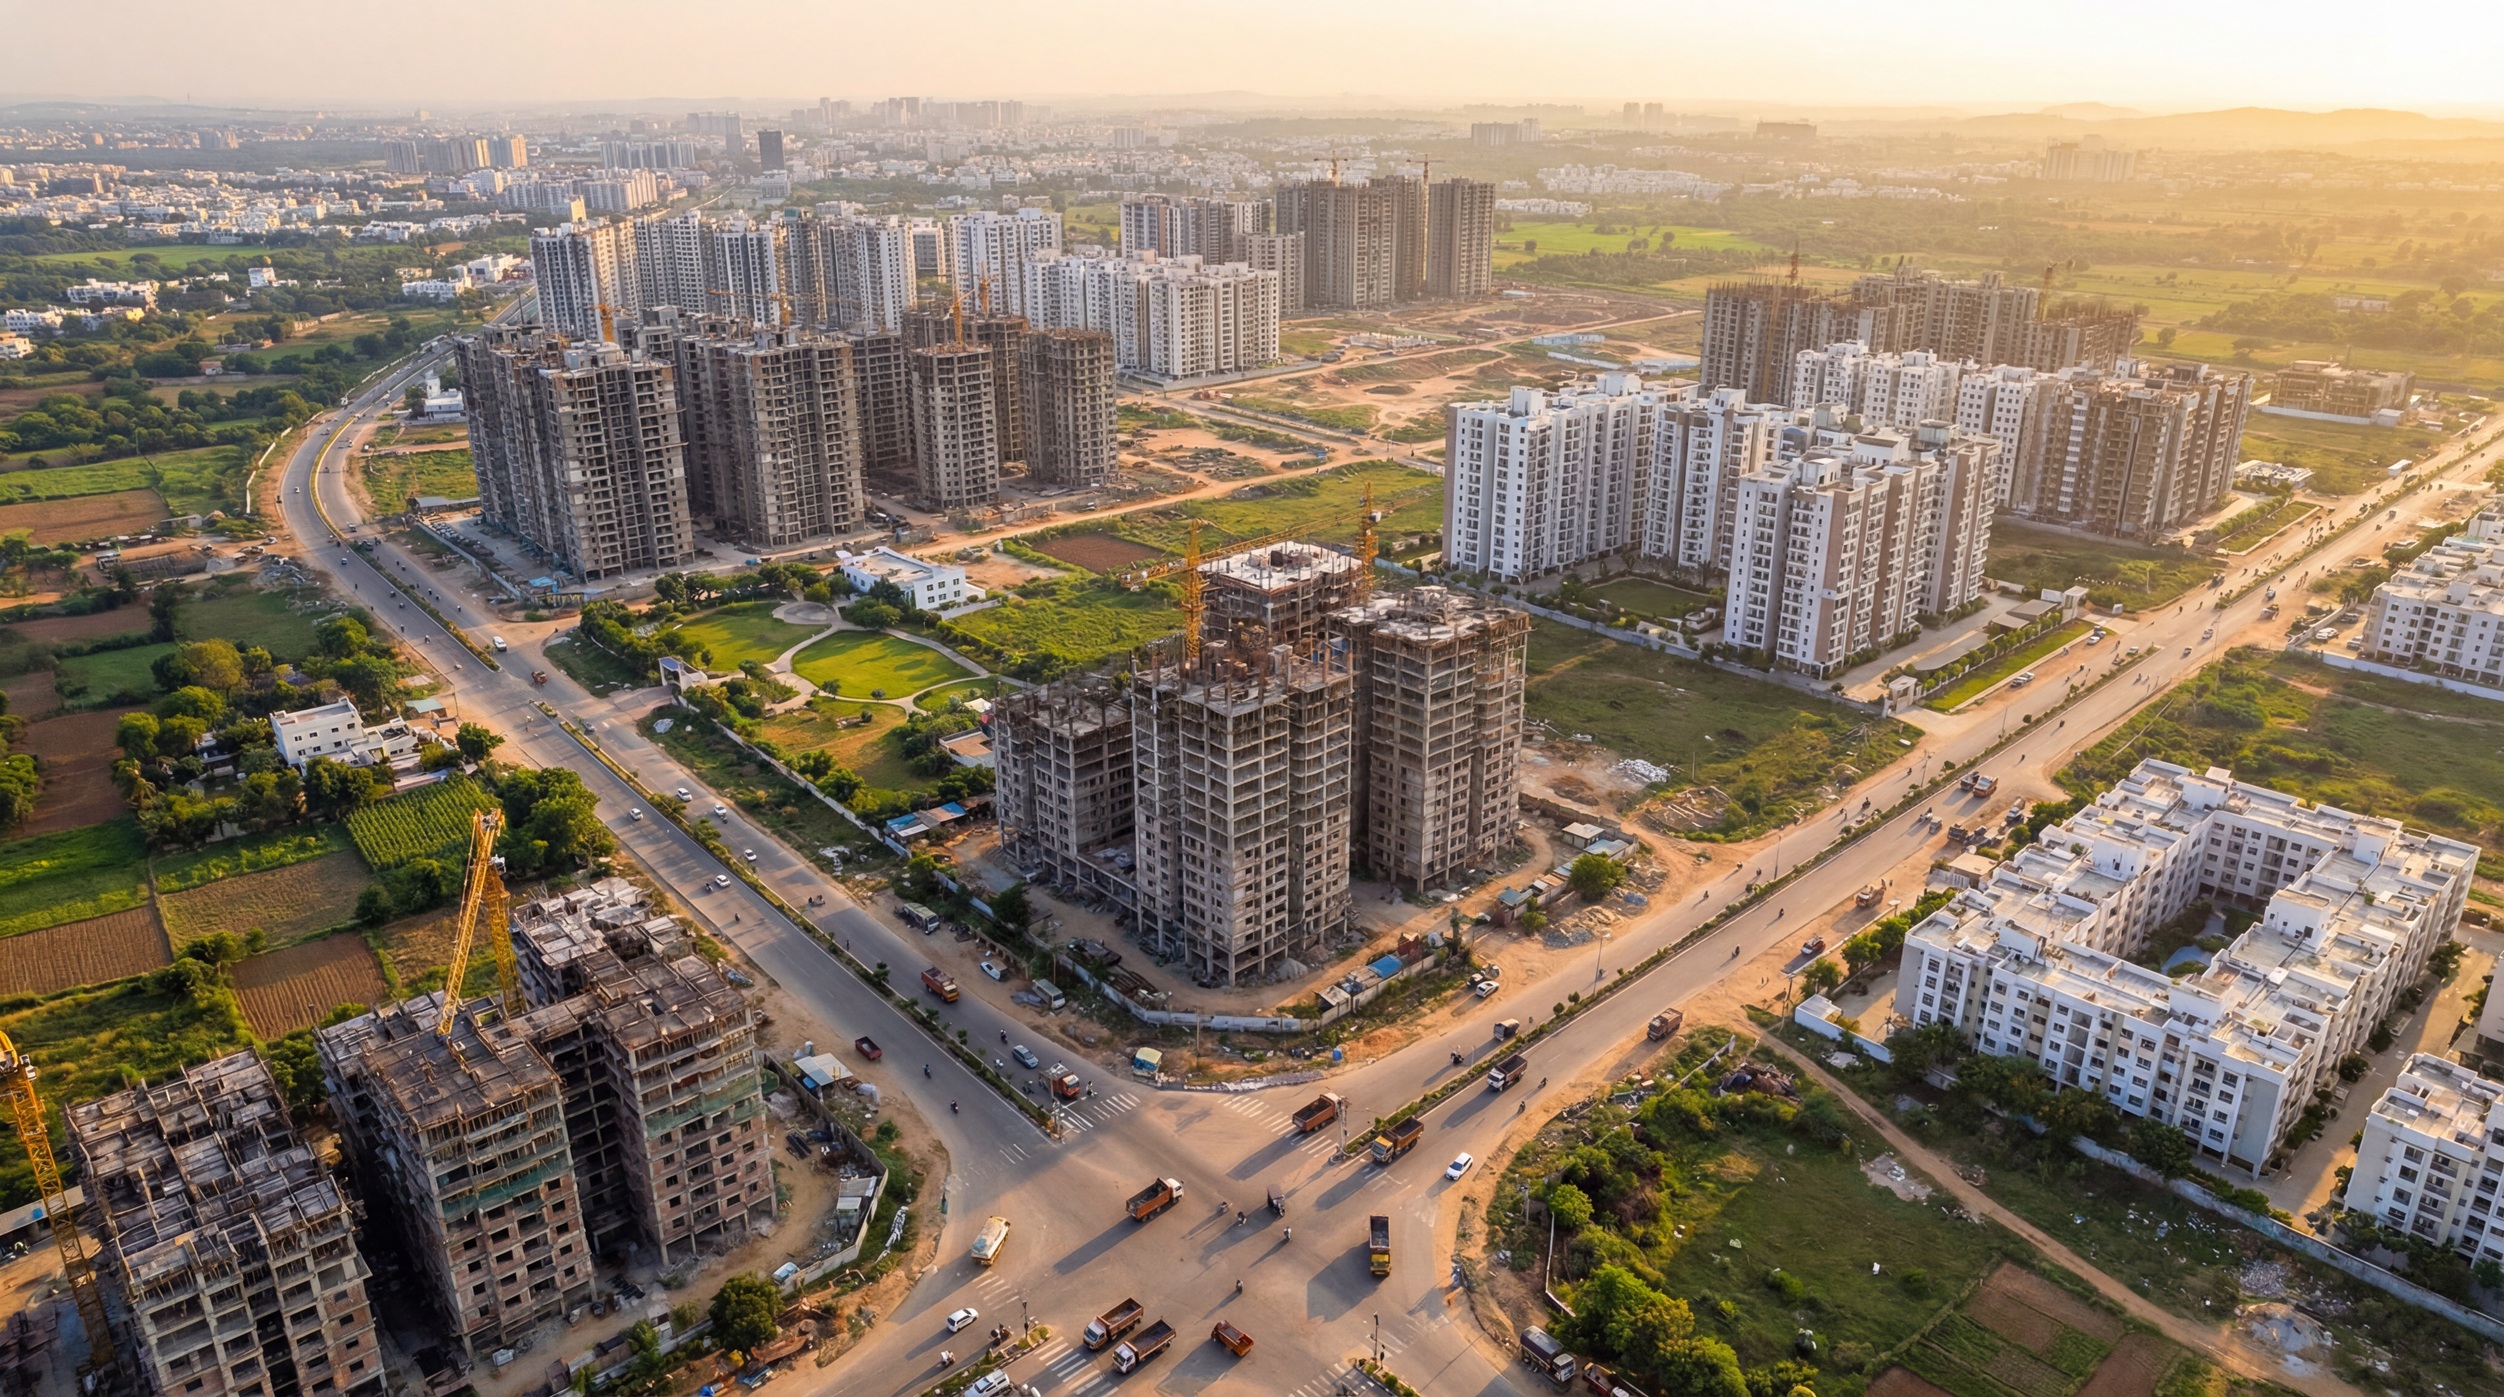
Navi Mumbai’s real estate market has seen genuine change in 2026, driven by the opening of Navi Mumbai International Airport, the Mumbai Trans Harbour Link (Atal Setu), and the planned Metro Line 8 corridor. If you’re looking to invest in Navi Mumbai property or understand current market rates, this guide breaks down pricing, trends, and infrastructure across all major localities — with every price and growth figure sourced and dated, not estimated.
Property rates below are sourced primarily from 99acres and Square Yards locality data, cross-checked against MagicBricks, Housing.com, and local broker aggregators where available, snapshot taken August 2026. Growth percentages vary noticeably by source and by the time window measured — we’ve cited the specific source and window (1-year, 3-year, or 5-year) for every figure rather than presenting a single blended number as fact.
Quick Overview: Navi Mumbai property rates range from roughly ₹8,700 to ₹28,550 per sq ft depending on area. Premium zones like Vashi command ₹28,000+, while affordable areas like Taloja start from ₹8,700. Actual year-over-year appreciation across most areas currently runs in the single digits (roughly 0-11%) rather than the 15-27% figures sometimes quoted online — Kharghar and Taloja in particular are close to flat or slightly down over the past year, even though both have stronger multi-year growth stories.
Navi Mumbai property rates in 2026 are influenced by three infrastructure shifts — the new NMIA airport, the planned Metro Line 8, and the MTHL (Atal Setu) — though the pace and size of that influence varies a lot by node and, in some cases, isn’t yet reflected in verified 1-year price data. Below, we break down current area-wise rates and the projects reshaping them, with sourcing for each claim.
Navi Mumbai Property Rates Area Wise 2026
Understanding property rates across different areas is crucial for making informed investment decisions. The table below shows current asking rates per sq ft, verified year-over-year and (where available) five-year growth, and key development projects in each major locality. Where a reliable annual figure wasn’t available from a credible source, we’ve said so rather than filling in an estimate.
| Area | Rate per Sq Ft (2026) | YoY Growth | 5-Yr Growth | Key Infrastructure | Best For |
|---|---|---|---|---|---|
| Vashi | ₹28,550 | ~7% | Not reliably available | Metro Line 8 (planned), MTHL connectivity | Premium buyers, professionals |
| Nerul | ₹22,000–₹24,000 | ~8-9% | Not reliably available | Metro Line 8 (planned), IT park expansion | Corporate professionals, families |
| Belapur | ₹20,000–₹22,000 | Not reliably available annually (only a ~1% quarterly move found) | Not reliably available | Metro Line 8 (planned), retail development | Families, SME professionals |
| Kharghar | ₹18,500–₹21,000 | ~0% (essentially flat) | Not reliably available | Metro Line 1 (operational, Belapur–Pendhar), tech parks | Tech workers, young families |
| Airoli | ₹19,450–₹23,900 | ~5-11% (varies by source) | Not reliably available | Metro line connection (planned), commercial hub | Corporate sectors, urban professionals |
| Ghansoli | ₹19,500–₹27,900 | ~2% | Not reliably available | Logistics parks, industrial development | Investors, business owners |
| Kopar Khairane | ₹17,000–₹21,150 | ~5% | Not reliably available | Upcoming metro access, retail zones | Middle-income families, investors |
| Ulwe | ₹13,100–₹18,300 | 6.2% | 26.1% | NMIA airport proximity | Budget-conscious investors, airport workers |
| Panvel | ₹13,350–₹15,000 | 6.9% | 32.7% | NMIA gateway city, SEZ development | First-time buyers, investors |
| New Panvel | ₹12,500–₹14,500 | 6.5% | 39% | Industrial zones, logistics hubs | Commercial buyers, investors |
| Taloja | ₹8,700–₹10,000 | -2.2% (a slight decline) | +6.7% | JNPT port connectivity, industrial parks | Budget investors, industrial buyers |
| Seawoods | ₹24,000–₹26,000 | ~9-10% | Not reliably available | Metro Line 8 (planned), upscale retail | High-end buyers, luxury seekers |
| Karanjade | ₹11,000–₹13,000 | ~0.5% | +14.4% | MTHL access, upcoming township projects | Value investors, young professionals |
Sources: Ulwe, Panvel, New Panvel, Taloja and Karanjade figures from 99acres property rates & price trends pages (Aug 2026 snapshot) — matching the site’s dedicated, independently-verified Ulwe property rates guide. Kharghar, Airoli, Ghansoli and Kopar Khairane from Square Yards locality pages (Aug 2026). Vashi, Nerul, Seawoods and Belapur from a cross-check of Revaa Homes, Casafy and 99acres-derived figures (Apr-Jul 2026). Where sources disagreed meaningfully, we’ve shown the range rather than picking one number.
How NMIA Airport Impacts Navi Mumbai Property Rates
The opening of Navi Mumbai International Airport (NMIA) on December 25, 2025, has genuinely reshaped parts of the local real estate landscape — though the size of that effect varies a lot depending on which figure you look at.
Airport-Driven Price Appreciation
Panvel apartment prices rose about 74% between FY2021 and FY2025, and plot prices in the airport vicinity surged roughly 93% over the same window to ₹80,000–₹85,000 per square yard, per Square Yards/Colliers data reported by Business Standard (July 2025). These are real, sourced figures — but they describe a specific FY2021-25 land and plot outlier, not a typical residential year-over-year growth rate. We couldn’t find a credible source supporting a general “30-50% price increase across surrounding localities” claim, so we’ve left that out rather than repeat an unsourced number. Ulwe’s current rate sits at roughly ₹15,450 per sq ft on average (₹13,100-18,300 across sectors), up 6.2% over the past year and 26.1% over five years, per 99acres — a real but far more modest picture than some of the round percentage figures you may see quoted elsewhere.
Long-Term Investment Potential
The airport is expected to create around 2 lakh jobs across aviation, logistics, hospitality, IT and retail (a mix of direct and indirect employment, per Tribune India), with ripple effects across the surrounding nodes. For investors, this points to properties near the airport being a longer-term structural story rather than a guaranteed short-term price spike — the 1-year data above shows that appreciation so far has been real but measured, not explosive.
Metro Line 8 and Its Impact on Navi Mumbai Property Rates
Metro Line 8 is a planned ~35-km corridor linking CSMIA and Navi Mumbai International Airport, approved under a DBFOT/PPP model with a Maharashtra government resolution issued in late 2025/early 2026 (₹22,862 crore project cost). Its confirmed 20-station route includes Vashi, Nerul, Seawoods, Sanpada, Juinagar, Belapur/Apollo, Sagar Sangam and Targhar, among others.
Metro Line 8 is government-approved and planned as a roughly 35-km airport-to-airport corridor with 20 stations. Earlier project schedules targeted construction from June 2026 and completion around May 2031; however, buyers should treat implementation timelines as subject to change until construction progress is independently confirmed.
Metro Connectivity Premium
We couldn’t find a credible, sourced figure supporting the commonly-repeated claim that “properties near metro stations command a 10-12% price premium” for Navi Mumbai specifically — it appears to be generic boilerplate reused across real-estate content sites rather than data tied to an actual study or transaction analysis. Treat any specific premium percentage you see quoted for metro proximity with some skepticism unless it’s sourced.
Areas on the Metro Line 8 Route
Seawoods, Vashi and Nerul are confirmed stops on Line 8’s planned route. Kharghar is not on Metro Line 8 — it’s served by the separate, already-operational Navi Mumbai Metro Line 1 (Belapur–Pendhar, opened November 2023). We’ve corrected this distinction here since the two lines are easy to conflate and Kharghar’s genuine metro access is a different, already-existing line, not the airport corridor project.
MTHL Impact on Navi Mumbai Property Rates and Valuations
The MTHL, also called Atal Setu, is a 21.8-km sea bridge (16.5 km sea + 5.3 km land) connecting Sewri (Mumbai) to Nhava Sheva (Navi Mumbai). It was completed and inaugurated in January 2024. Travel-time savings vary by specific route — reported figures range from roughly 2 hours down to 30-40 minutes for a South Mumbai-to-airport-corridor trip, and roughly 90 minutes down to about 25 minutes for a Sewri-to-Ulwe trip, per MMRDA.
Transformation Through Connectivity
The MTHL has genuinely made areas like Ulwe and Panvel more commutable for people working in Mumbai, which has broadened the buyer base for those nodes. MTHL is already operational, so unlike proposed infrastructure like Metro Line 8, its connectivity benefit is part of today’s actual transport network. Whether current property prices fully reflect that benefit cannot be established from asking-price data alone.
Key Infrastructure Projects Shaping Navi Mumbai in 2026
Panvel-Karjat Suburban Railway Corridor
A new 29.6-km double-line suburban railway corridor managed by MRVC will enhance connectivity between Panvel and Karjat. This corridor will integrate Navi Mumbai better with inland areas and the broader MMR region.
JNPT Port Expansion
Jawaharlal Nehru Port Trust (JNPT) expansion in Nhava Sheva continues to drive industrial and logistics development. Areas like Taloja benefit directly from this expansion, creating opportunities for commercial real estate investors — though as the table above shows, that hasn’t translated into residential price growth there over the past year.
SEZ and Industrial Development
SEZ (Special Economic Zone) development in Panvel, New Panvel, and Taloja continues to drive industrial real estate demand. These zones attract manufacturing and trading businesses, creating secondary demand for residential properties from workers.
Navi Mumbai Property Rates Area Wise: Detailed Breakdown
Premium Areas: Vashi, Seawoods, and Airoli
Vashi remains Navi Mumbai’s premium locality with the highest property rates at ₹28,550 per sq ft, up roughly 7% over the past year. As the CBD hub with corporate offices, IT parks, and premium retail, Vashi attracts high-income professionals and investors. Seawoods, at ₹24,000-₹26,000 per sq ft (up roughly 9-10% YoY), is an upscale residential hub with premium amenities and international retail. Airoli, at roughly ₹19,450-₹23,900 per sq ft (estimates vary noticeably by source), bridges premium and mid-segment properties, with strong IT and logistics presence appealing to corporate professionals.
Mid-Premium Areas: Nerul, Belapur, and Kharghar
Nerul (₹22,000-₹24,000 per sq ft, up roughly 8-9% YoY) is seeing steady growth from IT park expansion. Belapur (₹20,000-₹22,000 per sq ft) has retail development and existing metro connectivity via Line 1, but we couldn’t find a reliable annual growth figure for it — the only trend data we located was a roughly 1% quarterly move, nowhere near the double-digit annual figures sometimes quoted. Kharghar (₹18,500-₹21,000 per sq ft) is currently close to flat year-over-year (roughly 0%) despite its tech-park presence and Metro Line 1 access — a meaningfully different picture from the 24-27% growth figure that circulates for this area, which we could not verify. Check out why Kharghar is becoming a preferred residential hub.
Mid-Segment Areas: Kopar Khairane and Ghansoli
Kopar Khairane (₹17,000-₹21,150 per sq ft, up roughly 5% YoY) offers value with retail development, though its price sits toward the higher end of that range per current Square Yards data. Ghansoli (₹19,500-₹27,900 per sq ft — sources vary widely here) benefits from logistics parks and industrial development, with verified growth closer to 2% YoY rather than the 15-17% sometimes quoted.
Airport-Adjacent Areas: Ulwe, Panvel, and Karanjade
Ulwe (₹13,100-₹18,300 per sq ft, up 6.2% over the past year and 26.1% over five years per 99acres) is one of the residential nodes closest to NMIA, although road distance and travel time vary significantly by sector and route, and it appeals to airport-sector workers and long-horizon investors. The area’s growth is real but considerably more modest year-to-year than some circulating figures suggest — the multi-year trend is the stronger part of the story. Panvel (₹13,350-₹15,000 per sq ft, up 6.9% YoY and 32.7% over five years) is positioned as the gateway city to NMIA, with SEZ expansion and commercial zones driving demand. New Panvel (₹12,500-₹14,500 per sq ft, up 6.5% YoY and 39% over five years) is an emerging industrial and logistics hub. Karanjade (₹11,000-₹13,000 per sq ft) is close to flat year-over-year (roughly 0.5%) but has climbed about 14.4% over five years, with MTHL access supporting longer-term demand.
Budget-Friendly Areas: Taloja
Taloja (₹8,700-₹10,000 per sq ft) remains Navi Mumbai’s most affordable major area, with a strong industrial base through JNPT port connectivity. Its price has actually dipped slightly over the past year (roughly -2.2%) even as it’s up about 6.7% over five years, per 99acres — worth knowing if you’re evaluating it purely as a short-term appreciation play rather than for its industrial/logistics fundamentals.
Investment Tips Based on Navi Mumbai Property Rates 2026
Smart Investment Strategies
Airport-Adjacent Properties: Areas like Ulwe, Panvel and Karanjade have the airport corridor’s growth story behind them, and their 5-year figures (26-39%) show real cumulative appreciation. We couldn’t find a credible analyst projection for what happens next — claims of “8-12% annual appreciation over the next 5-7 years” for this corridor aren’t tied to any named research firm or analyst we could verify, so treat that kind of specific forward number skeptically regardless of where you see it.
Metro Corridor Positioning: Seawoods, Vashi and Nerul sit on Metro Line 8’s confirmed route, though implementation timelines should be treated as subject to change until construction progress is independently confirmed, so any price effect today remains anticipatory. We couldn’t verify a specific “10-12% premium” figure for metro proximity — it’s a reasonable general expectation, but not one we can back with a source.
MTHL Connectivity Play: Ulwe and Panvel have genuinely benefited from reduced Mumbai commute times via the MTHL, which has broadened their buyer base. MTHL is already operational, so unlike proposed infrastructure, its connectivity benefit is part of today’s actual transport network — whether current asking prices fully reflect that benefit isn’t something we can establish from listing data alone.
Rental Yield Focus: Kharghar, Nerul and Kopar Khairane attract working professionals with steady rental demand; Airoli and Ghansoli have strong rental appeal from corporate and logistics tenants. We don’t have current, sourced rental-yield percentages for these specific nodes to cite here — check listings directly for realistic current yield estimates.
First-Time Buyer Considerations: Panvel and New Panvel offer relatively lower entry prices, though at current rates (₹12,500-₹15,000 per sq ft), a budget of ₹50 lakh buys roughly 330-400 sq ft — a compact 1BHK-class unit, not a larger flat. Taloja and Karanjade stretch that budget further (roughly 385-575 sq ft) given their lower per-sq-ft rates.
Timing and Infrastructure: Areas where infrastructure is under construction or about to launch have historically seen some of the strongest gains, though timing any specific purchase around an infrastructure milestone carries real uncertainty — completion dates for large infrastructure projects in India have a track record of slipping.
None of the above is a recommendation to buy in any specific area — it’s a summary of what the current, sourced data shows about each node’s growth pattern so far. Your own timeline, budget, and risk tolerance should drive the decision, and a licensed real estate advisor or a SEBI-registered investment advisor (for the investment-planning side) can help you weigh it against your specific circumstances.
Navi Mumbai Property Rates: Market Trends and Projections 2026
Market Sentiment
Navi Mumbai property demand in 2026 is grounded in real fundamentals — genuine infrastructure delivery (the airport is open, the MTHL is operational), employment creation, and an affordability gap versus Mumbai. That said, the specific YoY growth figures across most areas are considerably more modest than some circulating claims suggest, as the table above shows.
Growth Drivers
NMIA Employment: roughly 2 lakh jobs expected across direct and indirect roles, creating housing demand over time. Metro Line 8: a ~35-km corridor that could improve connectivity once built; earlier schedules targeted construction from June 2026, but treat that timeline as subject to change until independently confirmed. MTHL Advantage: MTHL is already operational, so unlike proposed infrastructure, its connectivity benefit is part of today’s actual transport network — though whether current asking prices fully reflect that benefit isn’t something we can establish from listing data alone. Industrial Development: SEZ, logistics parks, and port expansion supporting commercial demand, notably in Taloja and Panvel, even where residential price growth has been flat.
Affordability Premium
Navi Mumbai is meaningfully cheaper than Mumbai proper — current data puts Mumbai’s overall average around ₹38,600 per sq ft versus Navi Mumbai’s roughly ₹19,300 per sq ft (Square Yards, Jul-Aug 2026), a gap of about 50%, larger than the 30-40% sometimes quoted. Vashi at ₹28,550 per sq ft is roughly 54% cheaper than Bandra West (~₹62,000/sq ft) and about 61% cheaper than Worli (~₹74,050/sq ft) on current asking rates — again, a bigger gap than the 20-30% figure you may see elsewhere.
Price Stability Factors
Navi Mumbai’s growth is anchored by tangible, delivered infrastructure — the airport is open and the MTHL is operational — rather than pure speculation. That said, the area-by-area data above shows a genuinely mixed picture: some nodes (Vashi, Seawoods, Nerul) are appreciating at a modest, steady single-digit pace, while others (Kharghar, Taloja, Karanjade) are essentially flat over the past year despite strong longer-term or infrastructure-driven narratives. Treat area-specific growth claims individually rather than assuming the whole region is moving at one uniform rate.
Frequently Asked Questions About Navi Mumbai Property Rates 2026
Which area in Navi Mumbai has the lowest property rates?
Taloja has the lowest property rates in Navi Mumbai at ₹8,700-₹10,000 per sq ft. Its year-over-year trend has actually been slightly negative (around -2.2%) even though it’s up about 6.7% over five years, per 99acres — so it suits budget and industrial-fundamentals-focused buyers more than short-term appreciation seekers. Panvel and New Panvel (₹12,500-₹15,000 per sq ft, roughly 6.5-6.9% YoY) are a step up in both price and recent growth.
How much have property rates in Navi Mumbai increased due to the airport opening?
Panvel apartment prices rose about 74% between FY2021 and FY2025, and airport-vicinity plot prices rose about 93% over the same window to ₹80,000-₹85,000 per square yard (Square Yards/Colliers data via Business Standard, July 2025) — but these are specific land/plot and multi-year figures, not typical residential 1-year growth. Current 1-year residential growth in airport-adjacent nodes like Ulwe and Panvel runs closer to 6-7%, per 99acres. We couldn’t verify a source for an “ongoing 8-12% annual appreciation over 5-7 years” projection — treat that kind of specific forward-looking claim skeptically.
Is Ulwe a good investment after the airport opening?
That depends on your timeline and risk tolerance rather than having one universal answer. Ulwe (₹13,100-₹18,300 per sq ft, up 6.2% over the past year and 26.1% over five years, per 99acres) is one of the residential nodes closest to NMIA, although road distance and travel time vary significantly by sector and route, and it has a real, sourced multi-year growth story, plus planned (not yet built) metro connectivity. It’s still meaningfully cheaper than premium zones like Vashi or Seawoods. Whether that makes it a good fit for you depends on your own financing, timeline, and risk appetite — consider speaking with a licensed real estate advisor before committing.
Will Metro Line 8 further increase Navi Mumbai property rates?
It’s a reasonable expectation that improved connectivity supports property values over time, but earlier project schedules targeted construction from June 2026 with completion around May 2031 — treat that timeline as subject to change until construction progress is independently confirmed, so any current price effect remains anticipatory rather than delivered. We couldn’t verify a specific “10-12%” premium figure for metro-adjacent properties in Navi Mumbai — that number circulates widely online but doesn’t appear to trace back to a named study or analyst. Confirmed stations on the route include Vashi, Nerul and Seawoods; Kharghar is not on this line (it’s served by the separate, already-operational Metro Line 1).
What is the best area to buy in Navi Mumbai for long-term appreciation?
There’s no single “best” answer — it depends on what you’re optimizing for. Ulwe, Panvel and New Panvel have the strongest verified five-year growth (26-39%) and lower entry prices, reflecting the airport-corridor and MTHL story. Kharghar and Nerul offer stronger existing infrastructure (metro, IT parks) but their recent 1-year growth has been flat to modest. None of these carries a guarantee — infrastructure timelines can slip, and past appreciation doesn’t determine future returns. A licensed real estate advisor can help weigh this against your specific goals.
How much cheaper is Navi Mumbai compared to Mumbai?
Navi Mumbai is roughly 50% cheaper than Mumbai overall on current asking rates (~₹19,300/sq ft vs ~₹38,600/sq ft, Square Yards, Jul-Aug 2026) — a bigger gap than the 30-40% figure sometimes quoted. Even Vashi, Navi Mumbai’s most expensive locality at ₹28,550 per sq ft, is roughly 54-61% cheaper than premium Mumbai localities like Bandra West or Worli. Budget-conscious buyers should note that a ₹50 lakh budget buys a compact 1BHK-class unit (roughly 330-575 sq ft depending on area) in Panvel, Karanjade or Taloja, not a larger flat.
Will MTHL impact Navi Mumbai property rates further?
MTHL (Atal Setu), completed and inaugurated in January 2024, has already meaningfully reduced Mumbai-to-Navi Mumbai commute times — savings vary by specific route, from roughly 2 hours down to 30-40 minutes on some corridors. This has already driven price appreciation in Ulwe and Panvel and broadened their buyer base. MTHL is already operational, so unlike proposed infrastructure, its connectivity benefit is part of today’s actual transport network. Whether current property prices fully reflect that benefit cannot be established from asking-price data alone.
Is the Navi Mumbai property market overheated or speculative?
The market is anchored by real, delivered infrastructure (an operational airport, an operational sea bridge) and genuine employment creation, which argues against a purely speculative bubble. That said, the wide gap we found between commonly-quoted growth percentages and verified current data (see the area table above) suggests some of the market narrative around Navi Mumbai has gotten ahead of what the numbers actually show — worth keeping in mind before treating any specific area’s “hot growth” reputation as settled fact.
Start Your Navi Mumbai Investment Journey Today
The 2026 Navi Mumbai property market is shaped by real, delivered infrastructure — an operational airport and sea bridge, with a metro line still to come — but the pace of price growth varies a lot by area, and it’s more modest almost everywhere than some commonly-quoted figures suggest. Whether you’re a first-time buyer, a professional looking for a metro-connected home, or an investor weighing the airport-corridor story, it’s worth checking any specific growth claim against a dated, sourced figure before acting on it. Get the latest area-specific real estate insights on NaviMumbai.com.
Related resources: Best Areas to Live in Navi Mumbai, Ulwe Property Investment & Airport Growth, Affordable Flats in Navi Mumbai Under 50 Lakhs, Complete Navi Mumbai Airport Guide.
Thinking about buying? Read our rent vs buy guide and check our detailed Ulwe sector-wise property rates guide.