The air in Navi Mumbai is measured at monitoring stations, and the Air Quality Index (AQI) turns those measurements into a number and a category. This guide explains the Indian AQI scale and the Navi Mumbai monitoring locations, shows how to read a CPCB reading, and sets out what the official health advice says. It does not display live readings, because the AQI changes and a number printed here would soon be out of date.
Quick answer: check the Central Pollution Control Board’s (CPCB) AQI dashboard for the latest available reading, then confirm the station, the timestamp and whether data is available. For a city summary, CPCB also publishes a dated daily AQI bulletin. This page explains how to read them. It is not a live feed.
Where to check the AQI
| Source | What it gives you | Keep in mind |
|---|---|---|
| CPCB AQI dashboard | The national dashboard for station readings | Readings are station by station, and a station may have no usable data for a period |
| CPCB daily AQI bulletin | One AQI value, category and prominent pollutant for each city, as an average of the past 24 hours at 4 PM, and how many stations contributed | It is a dated city summary, not the air outside your building at this moment |
| CPCB list of continuous monitoring stations | The names and operators of the stations in each city | It tells you where the stations are, not what they read today |
| Maharashtra Pollution Control Board | The state board that operates most of the Navi Mumbai stations | Use it for reports and notices about the state |
How to read a CPCB reading, step by step
- Open CPCB’s AQI dashboard.
- Find the city group and the station you want. CPCB groups many stations under a Navi Mumbai label, as the list below shows.
- Check the timestamp and any data status message before you read the number.
- Read the AQI category and the pollutant information the dashboard gives.
- Compare nearby stations where they are available. The nearest station is useful context, but it is not a measurement taken inside your home or on your street.
- For a city summary, use the dated CPCB bulletin.
If you want to keep a record, note the details of each reading. Leave a row blank if the data was not available.
| Station | Timestamp | AQI and category | Pollutant shown | Data status | Source and date checked |
|---|---|---|---|---|---|
Historical example: 14 October 2026, 4 PM
This is one CPCB bulletin, shown only to explain the columns. It is not a current reading.
| City | AQI | Category | Prominent pollutants | Stations participating |
|---|---|---|---|---|
| Navi Mumbai | 92 | Satisfactory | PM10, PM2.5 | 4 of 8 |
| Mumbai | 101 | Moderate | PM10 | 23 of 26 |
The figures come from the bulletin for that day, an average of the previous 24 hours. A city bulletin can list more than one prominent pollutant next to its city figure. The same bulletin also lists Belapur as a separate row, so the labels follow CPCB’s reporting groups. One day does not show a trend.
Stations listed under Navi Mumbai in CPCB’s reporting network
CPCB’s station list names these continuous monitoring stations under Navi Mumbai. Seven are operated by MPCB and one by the Indian Institute of Tropical Meteorology (IITM).
| Station | Operator |
|---|---|
| Airoli | MPCB |
| Kopripada, Vashi | MPCB |
| Mahape | MPCB |
| Nerul | MPCB |
| Sanpada | MPCB |
| Sector 19A, Nerul | IITM |
| Sector 2E, Kalamboli | MPCB |
| Tondare, Taloja | MPCB |
This table follows CPCB’s reporting labels. They do not necessarily match municipal boundaries, or every locality commonly described as Navi Mumbai. It is also separate from the air sampling sites in MPCB’s industrial studies.
Each station measures the air around its own site, so a reading in Taloja can differ from one in Nerul. A station may not contribute a usable AQI for a reporting period, and a participation count such as 4 of 8 does not explain why. The reason can be too little qualifying data, a communication gap or maintenance. Check the station’s timestamp and data status instead of assuming that every missing station is offline, and remember that missing data does not mean the air is clean.
How the AQI is worked out
India’s AQI considers eight pollutants: PM10, PM2.5, nitrogen dioxide (NO₂), sulphur dioxide (SO₂), carbon monoxide (CO), ozone (O₃), ammonia (NH₃) and lead. For a monitoring location, the pollutant concentrations that are available are converted into sub-indices, and the highest qualifying sub-index decides the station’s AQI. CPCB’s technical report says an overall AQI is calculated only when data is available for at least three pollutants, including PM10 or PM2.5, and that at least 16 hours of data is needed for a sub-index.
The AQI also describes an averaging period, not a single moment. CPCB uses 24 hour averages for pollutants such as PM10 and PM2.5, and running 8 hour averages for carbon monoxide and ozone. A recently updated AQI can still represent an averaging period, so check both the update timestamp and the measurement period, and do not read it as the pollution at that exact minute.
A city bulletin lists the prominent pollutant, which is the pollutant with the highest sub-index. A bulletin may name more than one. That tells you which pollutant is driving the number, not whether traffic, construction or something else produced it.
| AQI | Category | What CPCB says it may cause |
|---|---|---|
| 0 to 50 | Good | Minimal impact |
| 51 to 100 | Satisfactory | Minor breathing discomfort to sensitive people |
| 101 to 200 | Moderately polluted | Breathing discomfort to people with lung disease such as asthma, and discomfort to people with heart disease, children and older adults |
| 201 to 300 | Poor | Breathing discomfort to people on prolonged exposure, and discomfort to people with heart disease |
| 301 to 400 | Very poor | Respiratory illness on prolonged exposure, with effects more pronounced in people with lung and heart diseases |
| 401 to 500 | Severe | Respiratory impact even on healthy people, and serious health effects for people with lung or heart disease, which may be felt even during light physical activity |
The categories and health messages are from CPCB’s National AQI document and the government release that launched the index. PM10 and PM2.5 describe particles with aerodynamic diameters generally at or below 10 and 2.5 micrometres. CPCB sets these 24 hour concentration ranges for each category:
| Category | PM10 (µg/m³) | PM2.5 (µg/m³) |
|---|---|---|
| Good | 0 to 50 | 0 to 30 |
| Satisfactory | 51 to 100 | 31 to 60 |
| Moderately polluted | 101 to 250 | 61 to 90 |
| Poor | 251 to 350 | 91 to 120 |
| Very poor | 351 to 430 | 121 to 250 |
| Severe | Above 430 | Above 250 |
The AQI is an index and has no units. PM10 and PM2.5 are measured as concentrations in micrograms per cubic metre, so a PM2.5 concentration should not be compared directly with an AQI number. Phone apps may use a different AQI system, such as a US or European scale, so confirm which one an app uses before you compare its numbers or colours with CPCB’s. They are not interchangeable.
What affects the air in Navi Mumbai
MPCB’s revised action plan for Navi Mumbai, dated 24 April 2019, covers the city among Maharashtra’s non-attainment cities, which are the cities listed for not meeting the national air quality standards. It groups the sources of pollution in three ways. The studies behind it are several years old, so treat them as background and not as today’s picture.
- Area sources: household fuel use and construction activity, and dust lifted from roads.
- Industry: the plan counts 541 air polluting industries in the industrial cluster.
- Vehicles: the plan notes heavy truck traffic around the APMC market and says heavy duty vehicles accounted for 82% of vehicular particle emissions in its study, which used 2015 to 2016 vehicle numbers. That figure covers vehicle emissions only, not all pollution in the city.
The plan also tabulates monthly averages for particulate matter (listed as RSPM) at its Rabale station for April 2017 to March 2018. The figure was around 32 µg/m³ in July, against 184, 244 and 231 in November, December and January. That historical series shows higher concentrations in the winter months, at one station in one year. It does not establish a trend for today, and monthly averages should not be turned into daily AQI categories. The best time to visit Navi Mumbai covers how the seasons feel in the city, and our winter planning guide collects the season’s other guides.
MPCB’s report labelled March 2024 gives the Navi Mumbai industrial cluster an overall CEPI (Comprehensive Environmental Pollution Index) score of 54.1 and an air component score of 28. It compares the overall score with an earlier overall score of 66.32. These are scores for the industrial cluster, and neither figure is a daily AQI reading. Read the report at MPCB.
Using the AQI day to day
The National Centre for Disease Control (NCDC) gives advice for each AQI band in its Handbook for ASHA on air pollution and health (2025), separately for the general population and for vulnerable groups. It names the elderly, children, pregnant women and people with existing lung disease among those groups. The table summarises it.
| AQI | General population | Vulnerable groups |
|---|---|---|
| Good (0 to 50) | No special precautions | No special precautions |
| Satisfactory (51 to 100) | No special precautions needed | Cover the nose with a mask, cloth or scarf when going out, and avoid long physical exertion |
| Moderate (101 to 200) | Use a mask or cloth over the nose, and avoid long physical exertion | Mask, cloth or scarf when going out, no long exertion, and frequent water breaks |
| Poor (201 to 300) | Avoid outdoor exertion if possible, take water breaks, and use a mask or cloth when going out | Avoid heavy exertion outdoors, take water breaks, and keep doors and windows of a closed workplace shut while keeping enough ventilation |
| Very poor (301 to 400) | Avoid outdoor physical activity and extra indoor sources such as burning or smoking, and use a close fitted N95 or N99 mask when going out | Stay indoors as much as possible with low activity, use a close fitted N95 or N99 mask when going out, and avoid indoor sources |
| Severe (401 to 500) | Avoid outdoor physical activity, avoid indoor sources, drink plenty of water, and use a close fitted N95 or N99 mask when going out | Stay indoors and keep activity low, always use a close fitted N95 or N99 mask outside, and go out only if urgent |
Concerns do not begin only at 101. NCDC already advises vulnerable people to take care in the Satisfactory band. An AQI category is not an individual medical clearance, so ask your own doctor what applies to you, especially if you have asthma or a heart condition, are pregnant, or care for children or older relatives. The hospitals guide lists hospitals if you need care.
- Before outdoor exercise or sports, check the day’s category and the station nearest you, and see the table above.
- Before a trek or a long outing, check conditions at your destination, because a Navi Mumbai AQI does not describe a distant trekking route. Our winter treks guide explains the other checks, and the parks and gardens guide has places closer to home.
- Check the timestamp and the number of stations behind a figure, and look at the nearest station as well as the city value.
Diwali and firecrackers
Check the standing rules and any current court or local orders on firecrackers, which can differ from city to city. Refer to the local authority and the police jurisdiction responsible for your address, because this guide cannot give timings. You can compare the CPCB bulletins from before and after the festival to see how the city value changes. A change between two bulletins does not by itself show how much was caused by firecrackers, because the weather, which stations participated and other emissions can also change.
Frequently Asked Questions
What is the AQI in Navi Mumbai today?
Check CPCB’s AQI dashboard for the latest available reading, then confirm the station, the timestamp and whether data is available. This guide does not show live readings.
How many air quality stations are there in Navi Mumbai?
CPCB’s list of continuous monitoring stations names eight under its Navi Mumbai label: Airoli, Kopripada in Vashi, Mahape, Nerul, Sanpada, Sector 19A in Nerul, Sector 2E in Kalamboli and Tondare in Taloja. Seven are operated by MPCB and one by IITM. CPCB’s labels do not necessarily match municipal boundaries.
What AQI is considered good?
CPCB calls an AQI of 0 to 50 Good, with minimal impact, and 51 to 100 Satisfactory, which may cause minor breathing discomfort to sensitive people. The higher bands, from 101 upwards, carry stronger health messages, and NCDC advises vulnerable people to take care even in the Satisfactory band.
What do PM10 and PM2.5 mean?
They describe particles with aerodynamic diameters generally at or below 10 and 2.5 micrometres. India’s AQI considers eight pollutants, and the highest qualifying sub-index decides a station’s AQI. CPCB requires data for at least three pollutants, including PM10 or PM2.5.
Why does my phone app show a different AQI?
Apps may use a different AQI system, such as a US or European scale, or may use different stations or averaging periods. Confirm which system an app uses before comparing its numbers or colours with CPCB’s.
Why does the bulletin show fewer stations than the city has?
A listed station may not contribute a usable AQI for that reporting period, and the participation count does not explain why. Check the station’s timestamp and data status rather than assuming it is offline. Missing data does not mean clean air.
Is the air worse in winter?
MPCB’s tables for its Rabale station, from April 2017 to March 2018, show higher monthly particulate averages in November, December and January than in July. That is one station in one year, so check the latest AQI to see what the air is doing now.
Sources and a note on accuracy
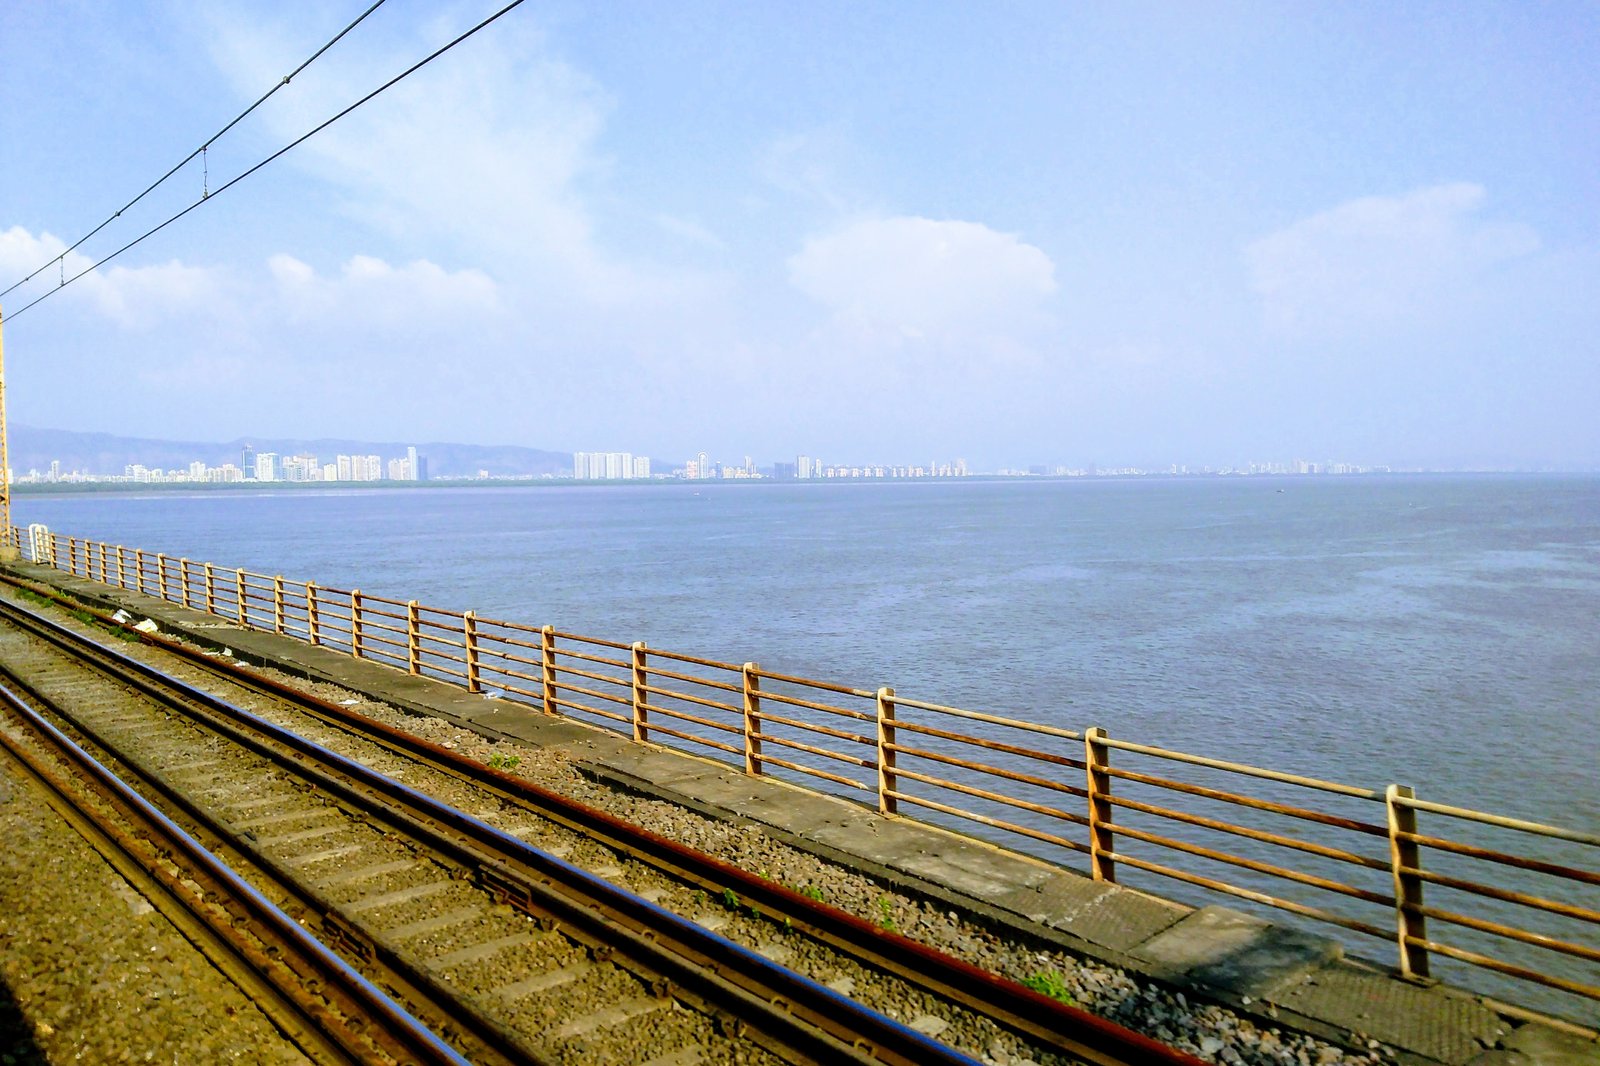
Sources checked on 15 October 2026. Station list: CPCB list of continuous monitoring stations. Dashboard and bulletins: the CPCB AQI portal and the CPCB AQI bulletin of 14 October 2026. Categories, breakpoints and the calculation: CPCB’s About National Air Quality Index, its National Air Quality Index technical report and the Press Information Bureau release. Health advice: the NCDC Handbook for ASHA (2025). Local studies: MPCB’s action plan for Navi Mumbai (2019) and CEPI report (March 2024). Featured photo: Vashi Bridge by Merimumbai, licensed CC BY-SA 4.0 via Wikimedia Commons, cropped and resized. It is an archival photo from September 2017 and does not show current air quality. This guide is general information, not medical advice. AQI values and station availability change, so confirm with the CPCB dashboard before you act. NaviMumbai.com is an independent information site and is not affiliated with CPCB, MPCB, NCDC or any government body named here.