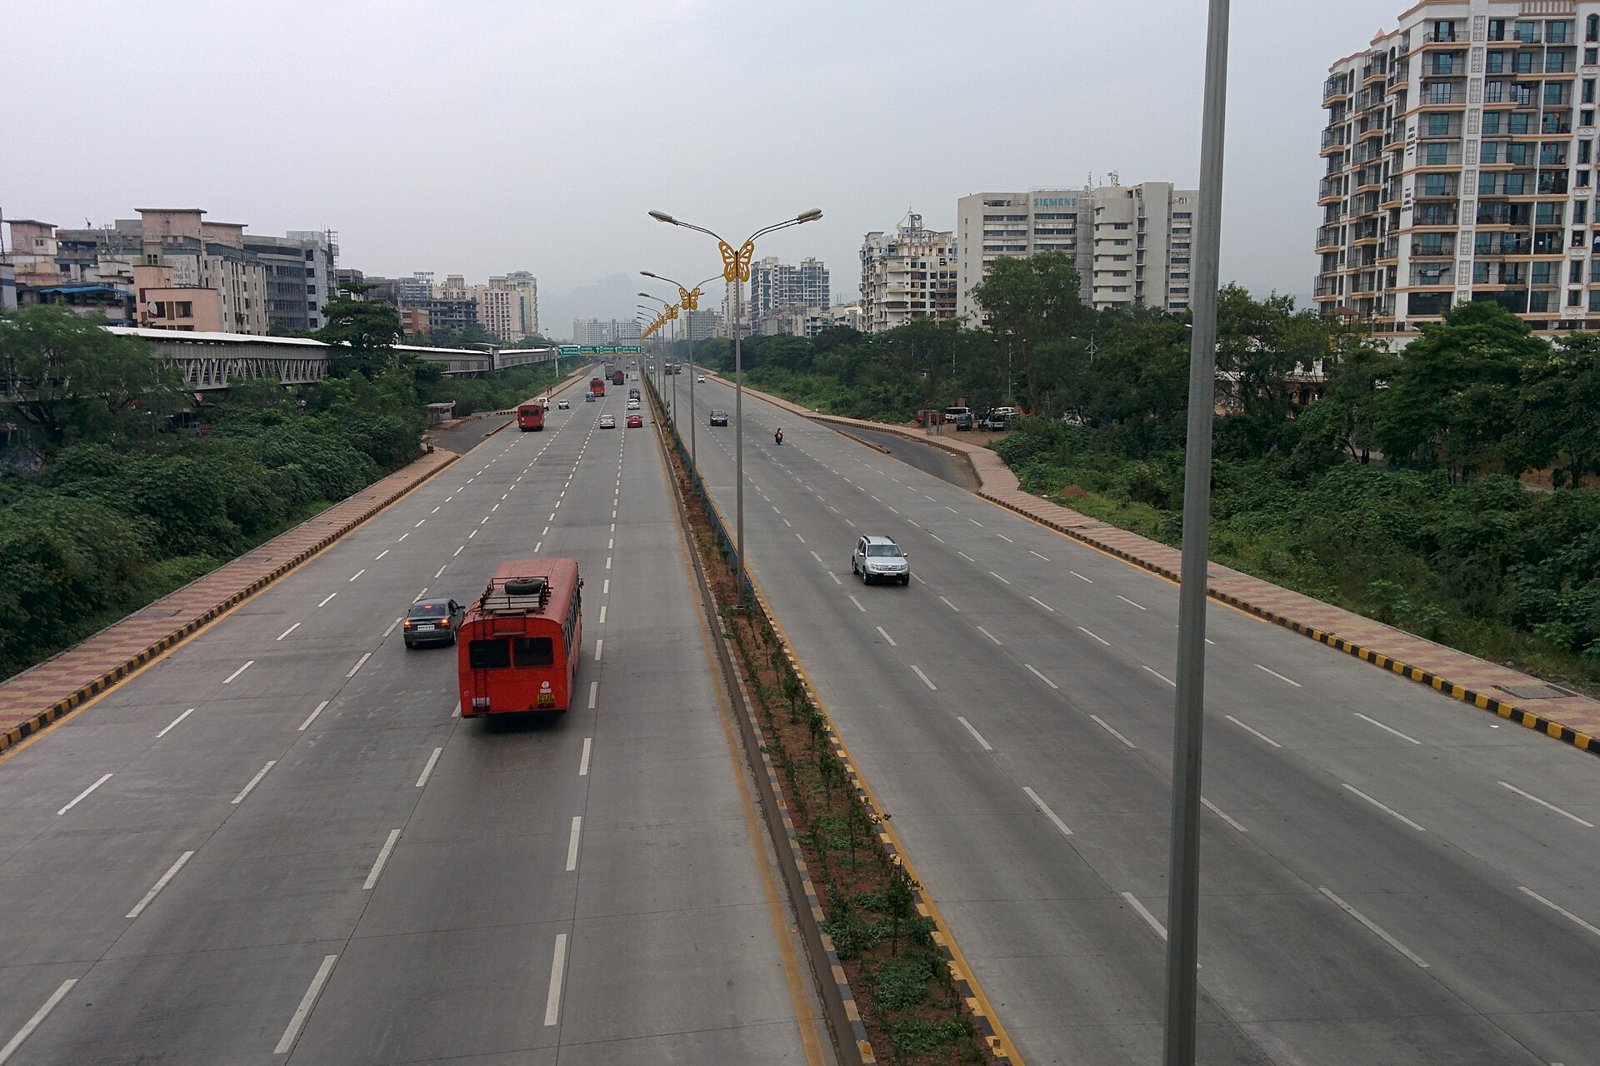
Sion Panvel Highway, photographed in 2014. Archival image, not a picture of current traffic.
Many residents say traffic in Navi Mumbai is getting worse. The figures that anyone can check are the vehicle counts the Maharashtra Transport Commissioner publishes for each Regional Transport Office, including the Vashi and Panvel offices, which serve the Navi Mumbai area. This guide sets out those counts, what they show and what they cannot show. It does not measure congestion, and it gives no travel times.
Quick answer: the published vehicle count for the Vashi and Panvel offices together rose from 370,972 on 31 March 2012 to 1,448,040 on 31 March 2025. That is about 3.9 times its 2012 level, an increase of about 290 per cent. Two wheelers and cars make up most of the fleet. These are vehicles recorded at two offices, not a measure of traffic on any road.
Vehicle counts recorded at the Vashi and Panvel offices
The Motor Vehicles Department, Maharashtra publishes office wise vehicle counts. The table uses the figures printed for 31 March of each year shown. The 2012 and 2015 figures come from its 2014-15 statistics report, the 2018 and 2021 figures from its 2020-21 statistics report, and the 2025 figure from its 2024-25 statistics information.
| As on | Vashi (Navi Mumbai) office | Panvel office | Together |
|---|---|---|---|
| 31 March 2012 | 257,831 | 113,141 | 370,972 |
| 31 March 2015 | 310,959 | 253,406 | 564,365 |
| 31 March 2018 | 424,271 | 424,600 | 848,871 |
| 31 March 2021† | 501,409 | 573,005 | 1,074,414 |
| 31 March 2025† | 644,439 | 803,601 | 1,448,040 |
The combined column is our addition. † The department labels its categorywise table for this date provisional. The office totals page used for the figures in the row does not carry that label. Figures are as first printed in these three editions.
Over the whole period the Vashi office’s count rose to about 2.5 times its 2012 level and the Panvel office’s to about 7.1 times. Between 2021 and 2025 the Vashi office’s count rose by about 28.5 per cent and the Panvel office’s by about 40.2 per cent. These are calculations from the published counts. They are not independent measures of traffic growth.
What these numbers do and do not show
- They count vehicles recorded at an office, not vehicles driving in Navi Mumbai. The Navi Mumbai Municipal Corporation’s Environmental Status Report for 2015-16 makes the same point, noting that a vehicle may be registered at the Vashi office without being used in the city directly.
- An office’s area is not a municipal boundary. Do not read the figures as a count for NMMC or for Panvel Municipal Corporation alone.
- They are not a traffic count. They do not say how many vehicles use a road at a given hour, how long a journey takes or where congestion builds up.
- Comparability over time is not fully established. The figures come from different editions of the department’s statistical publications. The published figures do not establish whether office boundaries, record adjustments or counting practices stayed fully comparable throughout the period. The calculations describe changes in the published office totals.
Checks on the historical figures
The 2014-15 table of office totals shows the Vasai office with no vehicles in 2012 and a count from 2013, and the Pen-Raigad office’s count falling by about 32 per cent in 2014. Changes like these are why office jurisdiction should be checked before the figures are read as uninterrupted growth in the fleet. The tables carry no notes on office boundaries, so the published figures do not show whether any transfer of records affects the Vashi or Panvel totals.
On provisional labels, the department marks its categorywise tables for 31 March 2021 and 31 March 2025 as provisional. The office totals pages we used for the other dates carry no such label. The table above uses the numbers as first printed, and later editions might revise them.
Four things that are easy to confuse
| Measure | What it describes |
|---|---|
| Vehicle population | Vehicles recorded in the relevant administrative dataset at a particular date. This is what the table above shows |
| New registrations | Vehicles newly registered during a reporting period |
| Traffic volume | Vehicle movements past a location over a specified period |
| Congestion | Delay or reduced operating performance, which needs measures such as speeds, journey times or queues |
Some traffic studies report passenger car units, or PCU. A PCU is a traffic equivalence measure and not a simple count of individual vehicles. The figures on this page should not be combined with PCU, annual registrations or any other measure as though they were the same thing.
This article does not use a consistent, citywide time series of observed traffic volumes. Corridor specific figures and transport studies exist, but their locations, dates, units and methods differ from the vehicle population data shown here.
What the fleet looks like
| Selected categories, as on 31 March 2025 | Vashi office | Panvel office |
|---|---|---|
| Two wheelers (motorcycles, scooters and mopeds) | 333,491 (51.7%) | 435,294 (54.2%) |
| Cars | 160,220 (24.9%) | 203,497 (25.3%) |
| Auto rickshaws | 39,984 | 40,225 |
| Trucks and lorries | 20,391 | 55,689 |
| Articulated and multi axle vehicles | 8,525 | 23,382 |
| All vehicles | 644,439 | 803,601 |
Selected categories are shown. Cars follow the source’s classification and exclude separately listed categories such as taxis, jeeps and station wagons. The source labels this table provisional.
Two wheelers and cars together are about 76.6 per cent of the vehicles at the Vashi office and about 79.5 per cent at the Panvel office. The Panvel office has noticeably more trucks, lorries and multi axle vehicles registered, but a registration is not a route, so this does not tell you where those vehicles run.
New registrations during financial year 2024-25
| Office | New registrations in 2024-25 |
|---|---|
| Vashi (Navi Mumbai) | 43,215 |
| Panvel | 64,991 |
These are annual additions recorded as new registrations. They are not the total vehicle population and not a daily traffic count. They are not reconciled here with the change in the year end totals, so do not treat them as the net change in the fleet.
Why these figures cannot measure infrastructure impacts
Roads, public transport and major destinations can change travel choices and route patterns. These registration figures do not isolate those effects. Assessing a project would need relevant before and after evidence, such as traffic counts, journey times, ridership and a clearly defined study area.
What to do with this
- For contacts, diversion notices and complaint routes, use our Navi Mumbai traffic guide.
- To compare ways of travelling, see the local train guide, Navi Mumbai Metro guide and NMMT bus guide.
- For vehicle registration and the Vashi and Panvel offices, see our RTO Navi Mumbai guide.
- To report a road problem, see our civic problems guide.
Frequently Asked Questions
What do the Vashi and Panvel RTO figures measure?
They count the vehicles recorded at each Regional Transport Office on a given date, which the department calls the vehicle population. They do not measure how many vehicles use a particular road.
How much did their published vehicle counts change?
Together the two offices’ published counts rose from 370,972 on 31 March 2012 to 1,448,040 on 31 March 2025, about 3.9 times the 2012 level, an increase of about 290 per cent. The Vashi office’s count rose to about 2.5 times and the Panvel office’s to about 7.1 times. The published figures do not show whether the offices’ boundaries and records were fully comparable across the period.
Does fleet growth show that congestion increased?
Not by itself. Congestion is delay or reduced performance on the road, and it needs measures such as speeds, journey times or queues. A larger count of registered vehicles does not say where or when vehicles are on the road.
Which vehicle categories are most common?
Two wheelers and cars. In the provisional 31 March 2025 figures they are about 76.6 per cent of the vehicles at the Vashi office and about 79.5 per cent at the Panvel office. Cars follow the source’s classification and exclude separately listed categories such as taxis and jeeps.
Why are the two office totals not a municipal population count?
An office’s area is not a municipal boundary, and a vehicle registered at an office may not be used in the city directly. The totals are not a count for NMMC or for Panvel Municipal Corporation.
Sources and a note on accuracy
Reviewed on 15 October 2026. The latest observation used is 31 March 2025. Page numbers below are PDF viewer pages, which can differ from the numbers printed on the pages.
| Data used | Document location |
|---|---|
| 2012 and 2015 office totals | The 2014-15 report, Table 19, PDF page 60 (printed page 37) |
| 2018 and 2021 office totals | The 2020-21 report, Table 19, PDF page 63 (printed page 35) |
| 2025 office totals and 2024-25 new registrations | The 2024-25 statistics information, PDF page 1 |
| 2025 Vashi vehicle categories | The same document, PDF page 3 |
| 2025 Panvel vehicle categories | The same document, PDF page 4 |
| Registration at an office does not mean use in the city | NMMC’s Environmental Status Report 2015-16, PDF page 53 |
The department’s statistics page links the 2024-25 document directly and also lists vehicle population documents for 2023 and 2024, which this article does not use. The 2014-15 and 2020-21 reports are linked above at the department’s own file addresses. The tables were read from the published pages, and later editions may revise the figures. Featured photo: Sion Panvel Highway aerial view by Abhijitsathe, licensed CC BY-SA 4.0 via Wikimedia Commons, cropped and resized. NaviMumbai.com is an independent information site and is not affiliated with the Motor Vehicles Department, NMMC or any agency named here.