This page compares the asking-price figures that property portals publish for the main Navi Mumbai areas, shows where the figures come from, and lists what to check before you trust any of them. It does not rank areas or say where prices will go. A locality average from a portal is a rough pointer, and the building, the area measurement and the full cost of buying decide what you actually pay.
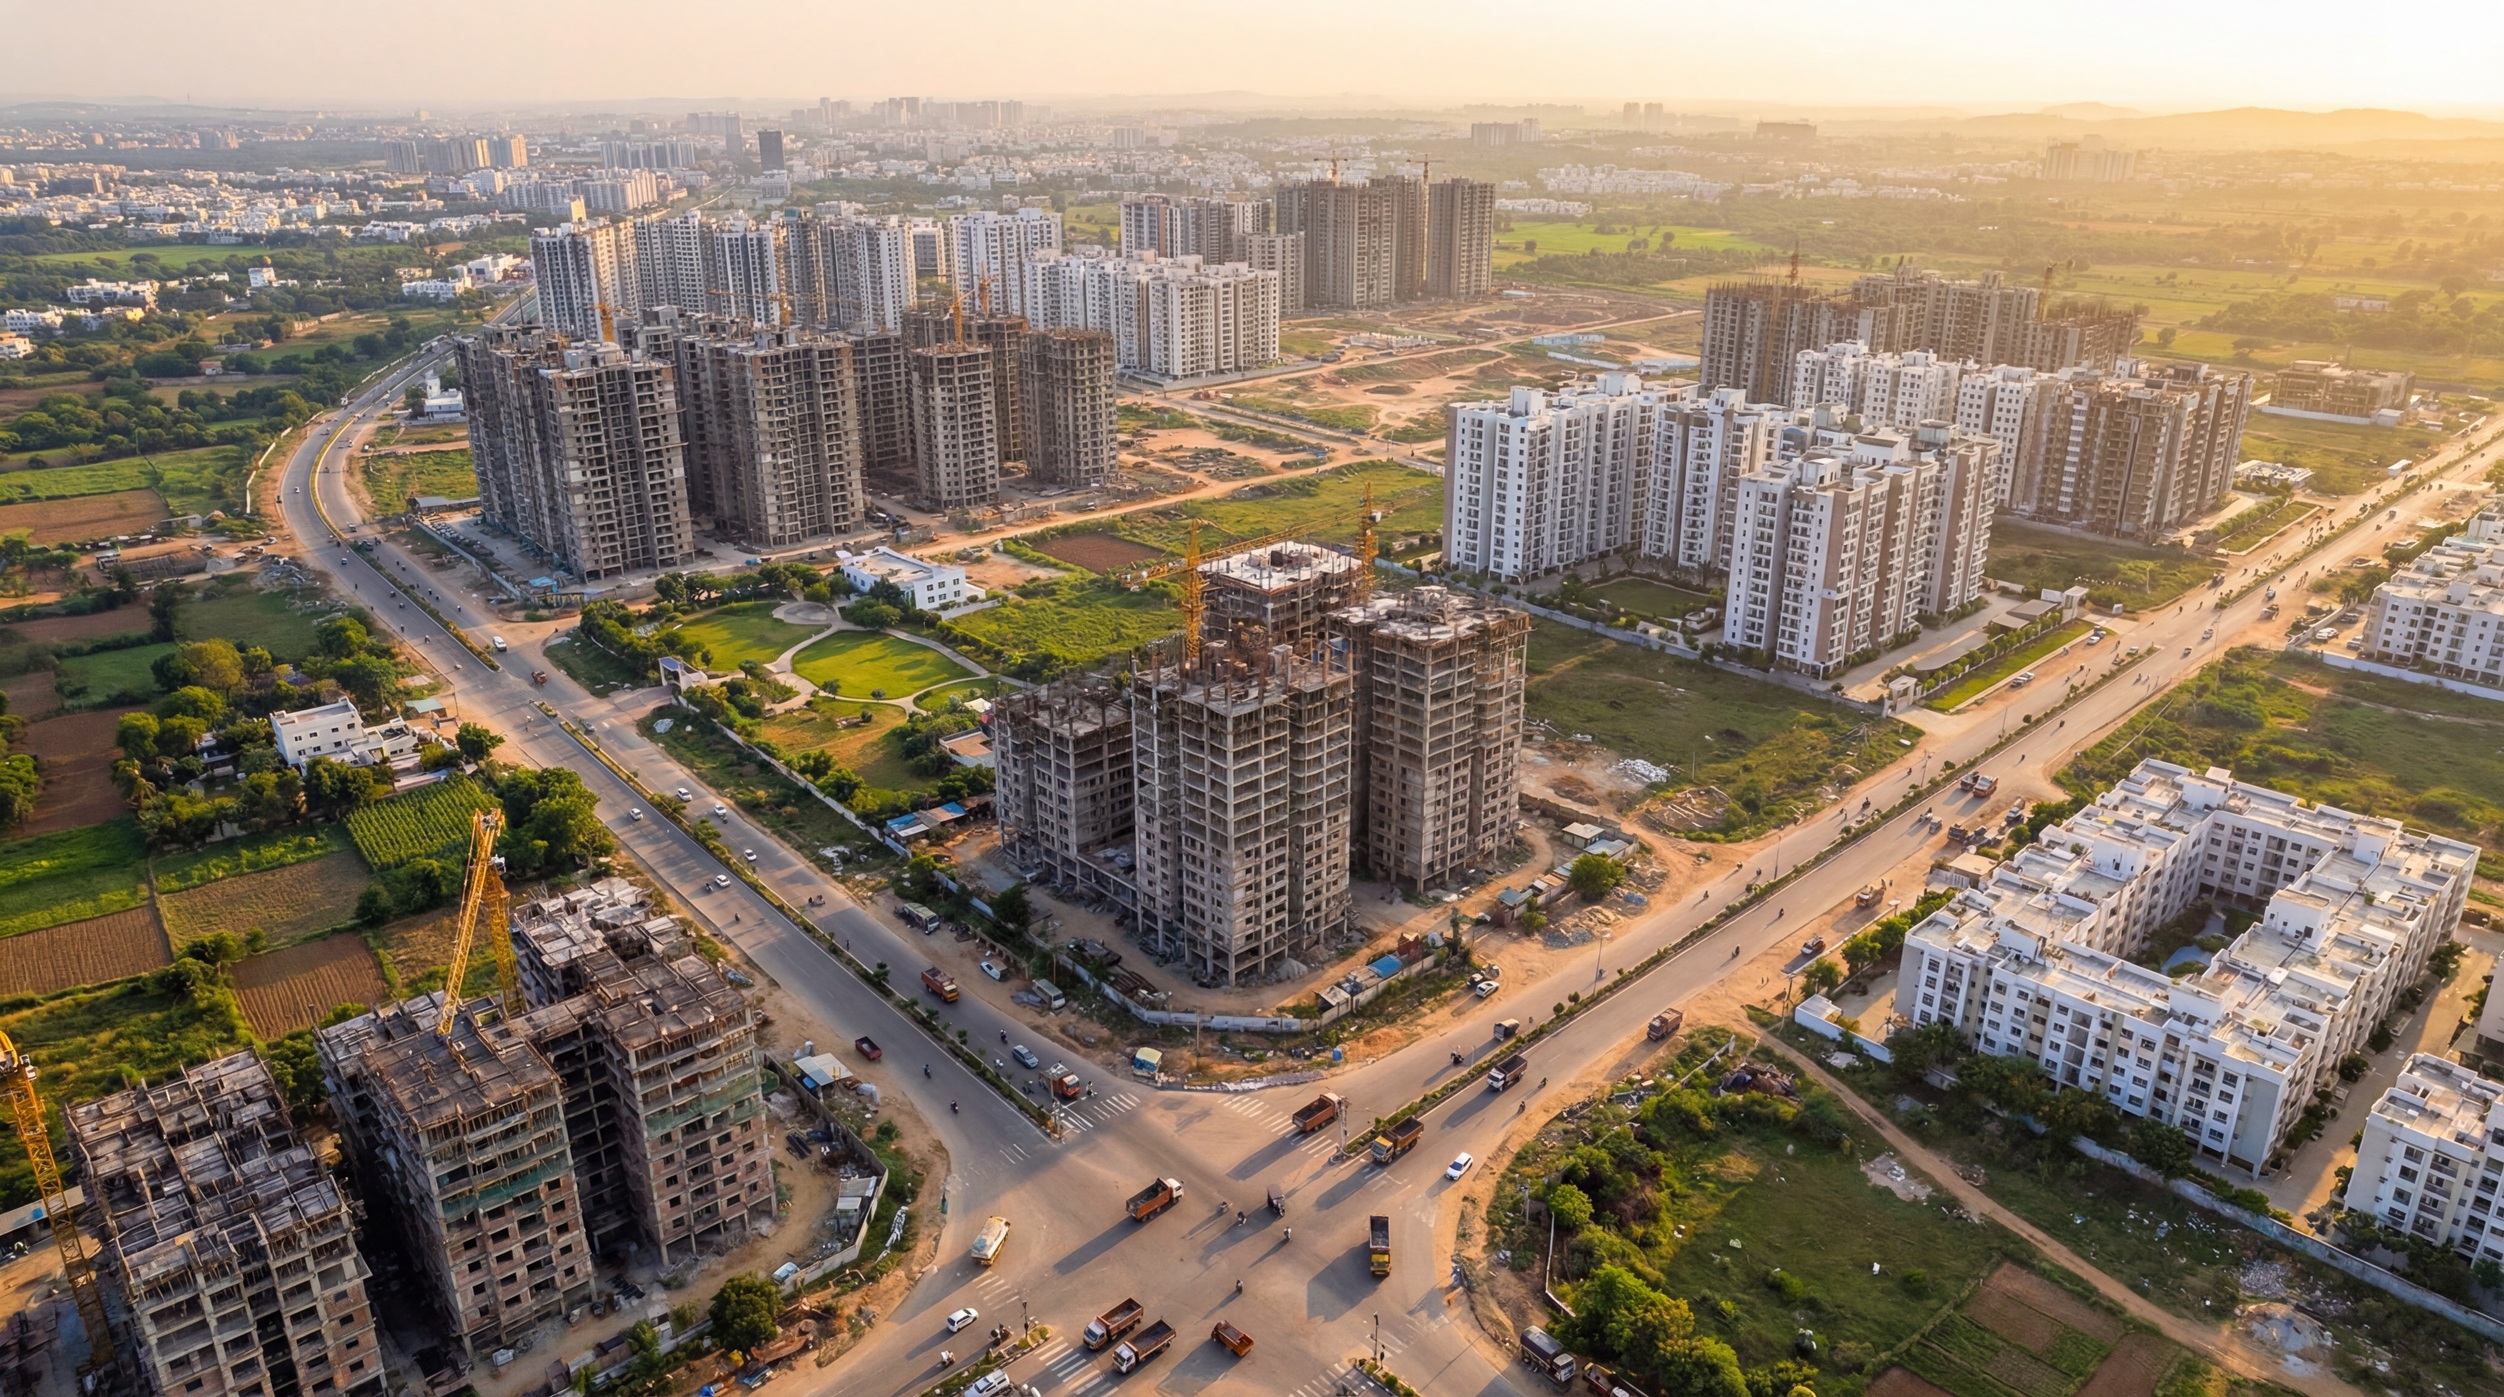
NaviMumbai.com is an independent publication, not a property broker, and is not affiliated with any portal or developer. The Square Yards figures below are from its locality pages as of 17 October 2026. The 99acres figure for Kharghar was read on the same date. The featured aerial image is illustrative only.
Quick Answer
Square Yards shows asking-price averages, labelled September or October 2026 on the pages, of about ₹30,750 per sq ft for Vashi, ₹29,850 for Nerul, ₹23,500 for Airoli, ₹19,350 for CBD Belapur, ₹19,150 for Kharghar and ₹11,650 for Panvel. The Panvel figure is lower than the ₹15,450 we showed earlier because the page now shows ₹11,650, the same as its ready-to-move figure. Those pages do not say which area measure the rate uses, and 99acres shows ₹18,550 for Kharghar on a carpet-area basis, so rates from different portals are not directly comparable. Use the table below to shortlist areas, then compare written quotations from specific buildings using the worksheet near the end of this page.
Published Asking-Price Indicators by Area
| Area | Published indicator | Amount per sq ft | Property-area basis | Reporting period | Source |
|---|---|---|---|---|---|
| Vashi | Apartment asking-price average, Square Yards (headline box) | ₹30,750 | Not stated on the page | September 2026, per the page. Its property-type breakdown shows ₹31,350 | Square Yards, Vashi |
| Nerul | Apartment asking-price average, Square Yards (headline box) | ₹29,850 | Not stated on the page | September 2026, per the page. Its FAQ and trend table show ₹30,750 | Square Yards, Nerul |
| Airoli | Apartment asking-price average, Square Yards | ₹23,500 | Not stated on the page | The FAQ says September 2026 and the trend text says June 2026 | Square Yards, Airoli |
| CBD Belapur | Apartment asking-price average, Square Yards | ₹19,350 | Not stated on the page | September 2026, per the page FAQ. Its trend chart shows ₹19,750 | Square Yards, CBD Belapur |
| Kharghar | Apartment asking-price average, Square Yards | ₹19,150 | Not stated on the page | The FAQ says September 2026, but the trend text places this figure at June 2026 | Square Yards, Kharghar |
| Kharghar | Locality average, 99acres | ₹18,550 | Carpet area, as labelled by the portal | Read on 17 October 2026 | 99acres, Kharghar |
| Panvel | Asking-price average, Square Yards (matches its ready-to-move figure) | ₹11,650 | Not stated on the page | October 2026, per the page FAQ | Square Yards, Panvel |
| Old Panvel | Asking-price average, Square Yards | ₹14,100 | Not stated on the page | The FAQ says September 2026 and the trend chart labels this figure June 2026 | Square Yards, Old Panvel |
| New Panvel | Apartment asking-price average, Square Yards | ₹14,100 | Not stated on the page | The FAQ says September 2026 and the trend text says June 2026 | Square Yards, New Panvel |
Read this before comparing the rows. The Square Yards pages do not say whether their per sq ft rate uses carpet, built-up or super built-up area, and the 99acres figure is labelled carpet area. A rate quoted on a larger area measure looks lower per sq ft than the same flat quoted on carpet area, so never compare a figure from one row with another on the assumption that the area basis is the same. These are asking prices from portals, not registered sale prices and not official valuations.
We left out Ulwe and Dronagiri because their figures need more explanation than a table row allows. The Ulwe guide compares a 99acres figure with a much lower Magicbricks band, and the Dronagiri guide notes that the Square Yards page shows two different figures for the same locality. Other areas such as Taloja, Seawoods, Ghansoli and Kopar Khairane are not in the table, so it is not a complete list of areas.
Why One Locality Number Can Mislead
The same Square Yards pages split their rates by project status. The status figures sit alongside the headline apartment average, and the two do not always agree.
| Area | Ready to move | Under construction | Headline apartment average |
|---|---|---|---|
| Vashi | ₹23,850 | ₹30,750 | ₹30,750 |
| Nerul | ₹24,200 | ₹29,550 | ₹29,850 |
| CBD Belapur | ₹16,100 | ₹18,350 | ₹19,350 |
| Kharghar | ₹15,250 | ₹17,600 | ₹19,150 |
| Panvel | ₹11,650 | ₹12,500 | ₹11,650 |
Source: the Square Yards pages linked above, per sq ft, as of 17 October 2026. Vashi’s headline figure matches its under-construction figure and Panvel’s matches its ready-to-move figure, while the Belapur and Kharghar headlines sit above both status figures. The pages do not explain how the headline is built. A ready flat and a flat in an unfinished building are different purchases, and a single average for either can hide a gap of several thousand rupees per sq ft.
Asking-price averages also move from quarter to quarter. These are the quarterly figures Square Yards displayed for the same pages on 3 October 2026, per sq ft:
| Area | September 2025 | December 2025 | March 2026 | June 2026 |
|---|---|---|---|---|
| Vashi | ₹28,300 | ₹32,150 | ₹33,350 | ₹30,750 |
| Nerul | ₹29,350 | ₹32,200 | ₹32,300 | ₹29,850 |
| Airoli | ₹22,450 | ₹22,700 | ₹23,900 | ₹23,500 |
| Kharghar | ₹17,200 | ₹18,500 | ₹18,500 | ₹19,150 |
| Panvel | ₹11,450 | ₹14,800 | ₹15,050 | ₹15,450 |
| New Panvel | ₹11,800 | ₹14,050 | ₹14,450 | ₹14,100 |
On 17 October 2026 the September 2026 point on these trend charts was blank on the pages we reread, and the Panvel page now shows a headline of ₹11,650, below the ₹15,450 in the Panvel row above. Portals revise these figures without notice.
The pages do not say what drove each change, and a portal’s average can shift with which listings it holds in a given quarter. Treat any confident prediction built on these figures with caution.
Asking Price, Transaction Price and Official Value
Three different numbers get called “the rate” for a flat. The asking price is what a seller or developer wants, and it is what the portal averages above report. The transaction price is what the buyer and seller actually agreed, and our Index II guide explains what the registration records can and cannot tell you. The ready reckoner rate is the government’s reference value used for stamp duty, and our ready reckoner guide shows how to check it. Do not treat any of the three as a stand-in for the others.
Area by Area: What to Check Locally
Each area has its own guide with the portal figures, their limits and local checks. The notes below say what to check, not who the area is best for.
- Vashi: compare the building and its age, since the portal shows a large gap between ready and under-construction rates, and check the exact sector and the distance to the station for your daily commute.
- Nerul: check which sector the listing is in and whether the quoted rate is for a ready or an under-construction flat, because the two differ by several thousand rupees per sq ft on the portal.
- Airoli: check the journey from the specific building to your workplace and the nearest operating station, and ask for the area measure in writing.
- CBD Belapur: the figure shown is for ready-to-move flats, so ask whether a quotation is for a ready or a new flat, and check the age and condition of the building.
- Kharghar: the two portals show different figures on different area bases, so compare quotations on carpet area. Sector-level rates on the portals differ widely, so use the exact sector.
- Panvel: Square Yards shows separate figures for Panvel, Old Panvel and New Panvel, so check which of these your listing falls under. Our Panvel vs Kharghar vs Taloja guide compares them.
- Ulwe: portals disagree because of area measure and listing mix, so insist on a written quotation with the area basis stated.
- Dronagiri: the portal shows inconsistent figures, so rely on current written quotations for specific buildings.
For help choosing between nodes on commute, schools and healthcare rather than price, see our best areas guide, and for the municipal boundaries see Areas in Navi Mumbai. If you are looking at land or homes in the wider planning area beyond the existing nodes, our NAINA guide explains how it is planned.
Infrastructure and Prices
Navi Mumbai International Airport, the Mumbai Trans Harbour Link (Atal Setu) and the Navi Mumbai Metro all affect how people get around, and each has its own guide: the airport guide, the Atal Setu guide and the metro route map. We do not claim any of them caused a price change. Asking-price data cannot separate the effect of one project from everything else happening in a market. This page does not use an airport-to-airport metro line as a pricing factor. When you assess a building, check the distance to a station or road that operates today and treat future projects as unconfirmed.
Quotation Worksheet
Ask every seller or developer for the same items in writing, then compare buildings on the total.
| Item | What to record |
|---|---|
| Quoted price | The agreement value and whether it includes parking, floor rise, clubhouse and other add-on charges |
| Area basis | Whether the area is carpet, built-up or super built-up, and the figure in sq ft or sq m for that basis |
| Rate per sq ft | Work it out yourself from the price and the area basis, rather than relying on the quoted rate |
| Parking | Whether it is included, its type and its price |
| Taxes | GST or other taxes where they apply, and who pays them |
| Stamp duty and registration | The amounts for your property, using our stamp duty guide and the ready reckoner rate |
| Other charges | Society transfer fees, maintenance deposits, legal and loan charges, and any development or infrastructure charges |
| Building status | Ready or under construction, the age of the building and whether an occupancy certificate exists (see our occupancy certificate guide) |
Our flat buying checklist covers registration and legal documents in more detail, and our home loan EMI calculator guide helps you test a budget. None of this is financial or legal advice, so talk to a licensed professional about a particular purchase.
Related Guides
- Ready Reckoner Rate in Navi Mumbai: How to Check the Official Figure
- Rent vs Buy in Navi Mumbai
- Navi Mumbai vs Thane
- Cost of Living in Navi Mumbai vs Mumbai
If property is only one of the options you are considering, see other ways to invest.
We have also published rate pages for Kamothe, Kalamboli and Taloja.
Frequently Asked Questions
Which areas in Navi Mumbai have the highest and lowest published rates?
Among the rows in our table, Square Yards shows the highest apartment averages for Vashi (₹30,750 per sq ft) and Nerul (₹29,850) for September 2026, and the lowest for the Panvel pages (₹11,650 to ₹14,100). Other nodes such as Taloja, Ulwe and Dronagiri are not in the table, so this is a ranking of our dataset and not of all of Navi Mumbai. The figures are asking prices from one portal and the order can change by source and month.
Which is the richest or most posh area in Navi Mumbai?
This guide does not rank areas by wealth. Asking prices are the nearest public measure, and in our table Vashi and Nerul show the highest. Price per sq ft also reflects building age, flat size and exact location, not only residents’ incomes. For amenities and infrastructure, see our best areas guide.
Why do portals show different rates for the same area?
The area measure, the mix of listings and the date can all differ. In our table Square Yards and 99acres show ₹19,150 and ₹18,550 for Kharghar, and the 99acres figure is labelled carpet area while the Square Yards page does not say. Compare quotations only on the same area basis, and treat any portal average as a rough pointer.
Is the rate per sq ft the price I will pay?
No. The rate is a portal’s asking-price average for a locality. What you pay depends on the building, the area measure, parking, taxes, stamp duty, registration and other charges. Use the quotation worksheet above and work out the rate yourself from the agreement value and the area basis.
What is the difference between an asking price, a transaction price and the ready reckoner rate?
The asking price is what a seller wants, the transaction price is what was agreed, and the ready reckoner rate is the government’s reference value used for stamp duty. They can differ and none of them replaces the others. See our ready reckoner guide and our Index II guide.
Have the airport, Atal Setu or the metro raised property rates?
Asking-price data cannot answer that, because it does not isolate the effect of one project. Each of these projects changes how people travel, so check the actual commute from a specific building rather than relying on a general claim about price effects.
Is Ulwe a good place to buy?
That depends on your budget, timeline and the specific building, and a locality average cannot answer it. Our Ulwe guide compares the portal figures, which differ because of area measure and listing mix, and lists local checks. Ask for a written quotation with the area basis stated before you compare it with anywhere else.
Is Navi Mumbai property a good investment?
This page cannot tell you that. An asking-price average is not a return, and this page gives no rental yield or price forecast for these areas. If you are weighing a purchase, compare the total cost of buying with your own budget and timeline, read our rent vs buy guide, and speak to a licensed advisor.
Sources and Verification Date
The figures come from the Square Yards locality pages linked in the tables, as of 17 October 2026: Vashi, Nerul, Airoli, CBD Belapur, Kharghar, Panvel, Old Panvel and New Panvel. The 99acres Kharghar page was read on 17 October 2026. Portals revise these figures, so what you see today may differ. No broker blogs were used and no value is estimated. This page gives no rental yields, forecasts, or claim of a link between a project and prices. Verify current quotations with the seller or developer and check official values before you decide.